PostgreSQL Benchmarks: Apple Intel MacBook Pro, 2011-2019
Apple's Intel-based laptops are very popular among developers, and that's as true of people who work on PostgreSQL as other groups. Tomorrow, the first shipping Apple laptops running on ARM CPUs instead of Intel are expected. That is likely to include at least a 13" MacBook Pro. I decided to prepare for that with a survey of PostgreSQL performance on my small herd of Apple laptops. Mine are all the 15" or newer 16" models.
Crunchy Data has already started digging into PostgreSQL on ARM performance as part of Crunchy Bridge, such as microbenchmarking on AWS Graviton 2. The OSS community around the Mac Homebrew tools seems ready for the ARM transition too. I'm hopeful that with some work, the new Apple ARM hardware can be as performant running Postgres as the Intel chips they replace. My results here say that ideally, Apple Silicon would hit 15K TPS single/60K TPS all core, or at least get close. Who wants to make an over/under bet?
I benchmarked them all with the consistent toolchain and method of my pgbench-tools software. That runs lots of PostgreSQL performance tests at various database sizes and client counts. For these MacBook CPU tests, the most useful tests I found for general CPU performance used single row "point" SELECT statements against a 1.6GB database, which is 100 on pgbench's size scale factor. Performance on that specific benchmark hasn't changed a lot (for laptop sized workloads) in the last few versions of PostgreSQL. Some of these results on older systems were using PG11, most are using PG12.
Here's the hardware I tested for this tour of benchmark results, and you can drill into detail about the systems I have here by digging into my Geekbench Profile.
| System | CPU Model | CPUs |
|---|---|---|
| 2011 16GB MacBookPro8,2 | Intel i7-2860QM CPU @ 2.50GHz | 8 |
| 2012 16GB MacBookPro9,1 | Intel i7-3615QM CPU @ 2.30GHz | 8 |
| 2015 16GB MacBookPro11,4 | Intel i7-4770HQ CPU @ 2.20GHz | 8 |
| 2017 16GB Intel NUC7i3BNB | Intel i3-7100U CPU @ 2.40GHz | 4 |
| 2019 16GB MacBookPro16,1 | Intel i7-9750H CPU @ 2.60GHz | 12 |
| 2019 64GB MacBookPro16,1 | Intel i9-9980HK CPU @ 2.40GHz | 16 |
| 2019 16GB Intel NUC10i5FNB | Intel i5-10210U CPU @ 1.60GHz | 8 |
Since I stayed away from laptops with Apple's butteryfly keyboard, I noticed a gap in my data around 2017. Intel had its own problems during this period too. I did pick up a cheap Intel 7th generation i3 CPU NUC in 2017, so I substituted that onto the chart. The single core performance fit midway in performance between the 2015 and 2019 MacBook models I had. The NUC hardware isn't a proper laptop chip, but the thermal limits of the form factor make them perform more like laptop CPUs than desktop one. I also have a 2019 10th gen i5 NUC I added for comparison. The two NUCs are running Ubuntu Linux instead of Mac OS.
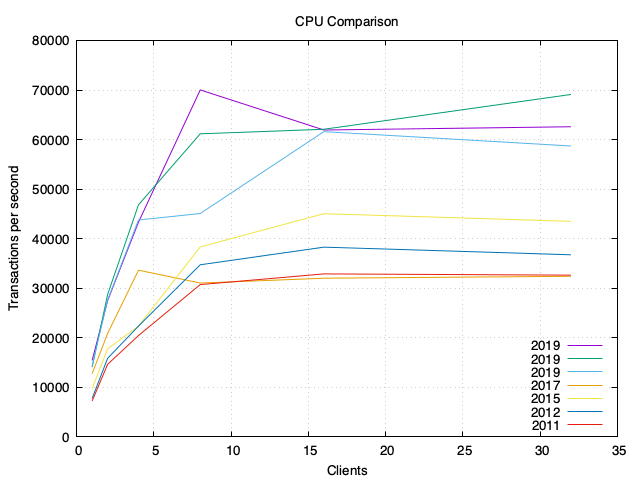
I like data tables as much as charts, and parts of the story here are easier to see that way:
| server | 1 | 2 | 4 | 8 | 16 | 32 |
|---|---|---|---|---|---|---|
| 2011 16GB MacBookPro8,2 | 7252 | 14644 | 20471 | 30749 | 32894 | 32647 |
| 2012 16GB MacBookPro9,1 | 7781 | 15861 | 22380 | 34743 | 38294 | 36754 |
| 2015 16GB MacBookPro11,4 | 9770 | 17795 | 22372 | 38341 | 45048 | 43497 |
| 2017 16GB Intel NUC7i3BNB | 12789 | 20870 | 33649 | 31053 | 32029 | 32409 |
| 2019 16GB MacBookPro16,1 | 14353 | 27588 | 43784 | 45089 | 61603 | 58705 |
| 2019 64GB MacBookPro16,1 | 14105 | 28733 | 46836 | 61167 | 62083 | 69101 |
| 2019 16GB Intel NUC10i5FNB | 15444 | 27496 | 43341 | 70015 | 61927 | 62584 |
It's nice to see that both single-core and multi-core results have doubled during this 8 year stretch of time.
